The cost of a failure is rarely limited to the asset that failed.
By the time a transformer, a switchgear panel, a UPS or an LV board causes an operational problem, the business has usually absorbed a much larger bill: lost production, emergency call-outs, repeat investigations, damaged equipment, unplanned capital and a quarter’s worth of engineering attention.
None of that appears on the repair invoice. And the invoice is the number that gets discussed.
Start with the hour
The reason electrical risk is chronically under-priced is that the cost of monitoring is easy to quantify and the cost of failure is not so the comparison gets made against zero.
It shouldn’t be. Research by ITIC into hourly downtime costs found that a single hour of downtime costs 98% of firms at least $100,000, and 86% of businesses put the figure at $300,000 or higher.
That’s a general industrial finding, and every site is different. But it establishes the order of magnitude, and it makes one thing clear: for most operations of any scale, the arithmetic is not close. A monitoring programme measured in thousands is being compared with an exposure measured in hundreds of thousands per hour.
The wider figure is just as stark. A CIRED paper by Schneider Electric engineers, drawing on the pan-European power quality survey, found that in industry the cost of poor power quality can reach 4% of annual turnover, and that an estimated 30–40% of all business downtime is power-quality related. For a £50 million site, 4% is £2 million and almost none of it will be recorded anywhere as a power quality cost.
What an unmonitored asset costs when it fails
Nestlé’s largest soluble coffee factory, producing around a million jars and running 365 days a year, had suffered a series of unplanned stoppages. The decisive event came in April 2020: a short circuit inside an unmonitored section of the main substation caused a 14-hour shutdown costing approximately $588,000.
The operative word is unmonitored. Not un-maintained, not old, not neglected.
A section of the main substation where nobody had visibility, in a facility sophisticated enough to know its downtime cost per hour to the nearest thousand.
The site moved from reactive to predictive maintenance afterwards, with the stated aim of avoiding three stoppages a year.
Some costs are easy to identify, such as an emergency repair, contractor callout or failed component.
Others are less visible but can be just as damaging.
Every repeated investigation consumes engineering time. Every temporary fix leaves open the possibility that the fault will return. Every maintenance decision made without enough evidence increases uncertainty.
Poor electrical infrastructure visibility can lead to:
- Maintenance being carried out on the wrong asset
- Components being replaced before the root cause is understood
- Repeat faults and temporary fixes
- Delayed maintenance or investment decisions
- Engineering teams spending more time firefighting
- Reduced confidence in asset reliability
This is where poor visibility becomes expensive.
The organisation cannot clearly see what is happening, why it matters or which action should take priority.
The costs that never get attributed
Emergency repairs, contractor call-outs and failed components are visible. The larger costs are structural and rarely land in a line item.
- Every repeated investigation consumes engineering time that was scheduled for something else.
- Every temporary fix leaves the fault live.
- Every maintenance decision made without condition evidence carries a risk of being aimed at the wrong asset — and when maintenance is carried out on the wrong asset, the organisation pays twice and gains nothing.
That is where poor visibility becomes expensive: not in the failure, but in the accumulated cost of acting without evidence.
Components replaced before the root cause was understood.
Maintenance carried out too early on stable assets and too late on deteriorating ones.
Capital deferred because the case couldn’t be made, or spent because it couldn’t be challenged.
None of it shows up as a failure. It shows up as a maintenance budget that keeps growing while reliability doesn’t improve.
Capacity you have already paid for
There’s a cost that sits entirely outside the failure conversation, and it’s often larger than the maintenance overspend.
In a power quality and load study we commissioned on a client site over December 2025 and January 2026, current harmonic distortion generated by internal loads exceeded 20%, with total demand distortion running between roughly 20% and 35% against IEEE 519’s 15% guideline. Once derating for harmonic pollution and reactive power was accounted for, the effective available capacity of a 1,000 kVA distribution transformer had fallen to 42%.
The site had paid for 1,000 kVA and could usefully draw on less than half of it.
If that site had hit a capacity ceiling and been quoted for a larger transformer or an upgraded supply, the capital case would have looked entirely sound – and would have been aimed at the wrong problem. Filtering and correction cost a fraction of a supply upgrade.
Age isn’t the risk. Not knowing the age is.
Many sites are running ageing assets, rising demand and constrained engineering resource simultaneously. The instinct is to treat age itself as the problem. It isn’t, quite.
The HSE’s guidance on switchgear safety notes that manufacturers typically quote a 20-year design life for vacuum switchgear, while observing that equipment of that age and older remains in service. Its position is that reliability to date is not evidence of reliability ahead, and that owners need a strategy for the point at which equipment reaches its design limit.
Load conditions move that limit. Manufacturer data for LV air circuit breakers shows that a 10 °C rise in average ambient temperature cuts component service life by approximately half, and that duty cycling has a comparable effect — a device rated for 10,000 operations lasts around 27 years at one cycle a day and around seven years at four.
Which means the number that matters isn’t the asset’s age. It’s the gap between the age you assume and the life it has actually consumed. Sites get caught by that gap, not by age.
Here’s what it looks like in practice.
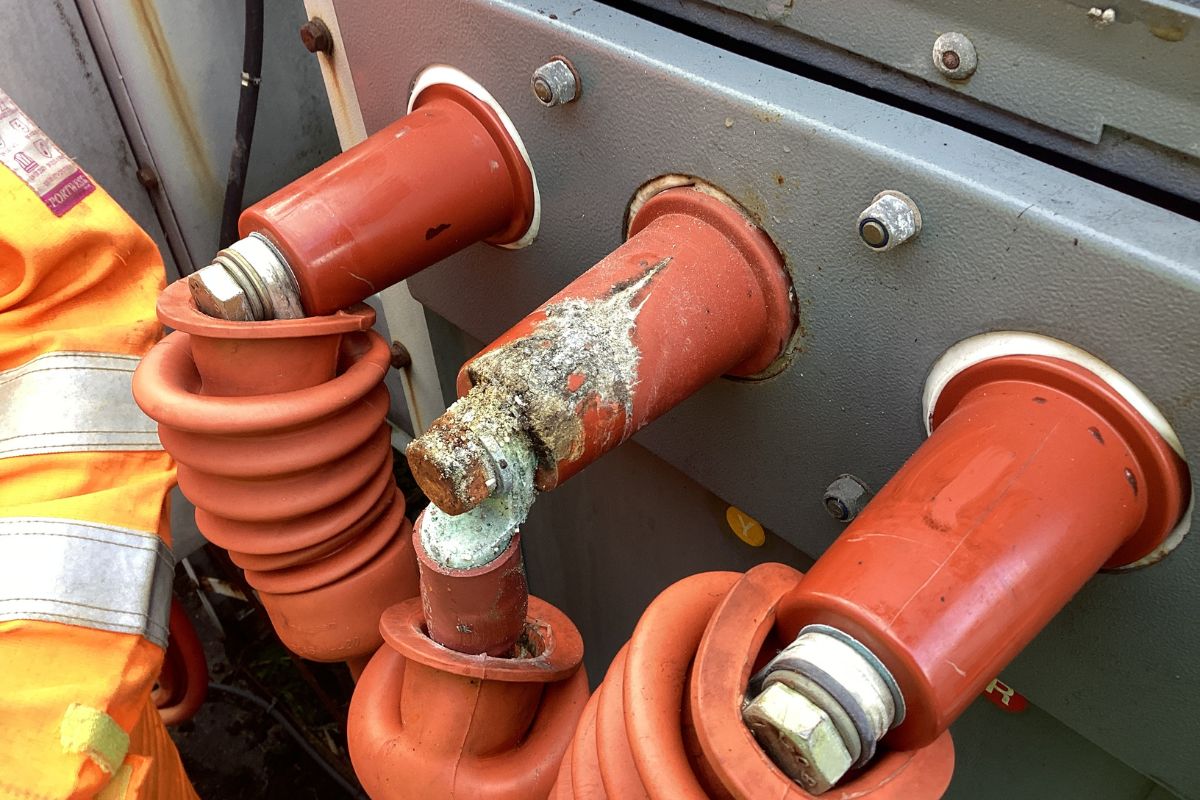
- Reviewing the HV infrastructure at a UK food manufacturer, we found circuit breakers that had not been maintained since 2008 – twelve years overdue.
- A fault would not have been reliably protected, and the DNO could have forced a shutdown on protection grounds.
- On the transformer, every core clamp had vibrated loose and one was in contact with the LV windings.
- The maintenance records were intact. They recorded what had been done, not what had changed.
There’s a safety dimension too. Germany’s public insurers’ damage database attributes around 31% of all fires to electricity – the largest single category in their data in Germany.
Thermal deterioration in electrical assets is one of the few risks that is both progressive and detectable well in advance.
Building the case for spending money
Engineering teams generally recognise infrastructure risk before the business does. The difficulty is proving it well enough to secure budget against competing bids that arrive with clearer numbers.
Condition evidence is what closes that gap. Monitoring data can show asset deterioration, repeated events, power quality problems and increasing load stress and, critically, it provides a baseline before and after intervention, so the organisation can see whether the money achieved what it was supposed to.
That moves the conversation from we believe this asset is becoming a risk to here is the deterioration rate, here is the operational exposure, and here is what the intervention costs against it. The second version competes for capital. The first rarely does.
It also cuts the other way, which is worth saying out loud. Sometimes the evidence shows an asset is stable and the replacement can wait. On one university site, eight months of continuous partial discharge data supported deferring a transformer replacement rather than committing capital on the basis of uncertainty. Deferred capital counts as a return too.
Where the real cost sits
Not in the asset that fails. In the period beforehand, when the risk was developing and no one could see it and in every decision made during that period was without evidence.
The goal isn’t to monitor everything. It’s to monitor the assets whose failure would actually stop the site, and to act on what they show while acting is still cheap.
Acteniq helps engineering teams put numbers to electrical infrastructure risk: assessing critical assets, monitoring what matters, interpreting the evidence, and delivering the maintenance, remedial work or modernisation it points to. Work with engineers, not an account team.
See how one food manufacturer moved from emergency call-outs to planned intervention
Need to put a number on your electrical infrastructure risk before the next budget round?
Sources cited in this piece
- ITIC, Hourly Downtime Costs Rise: 86% of Firms Say 1 Hour of Downtime Costs $300K, May 2019
- Ignatova, Lafort & Bilic (Schneider Electric), Power Quality Management Methodology, CIRED 2015, paper 0726
- Nestlé Nescafé customer story, cited in Schneider Electric, Benefits of shifting from traditional to condition-based maintenance in electrical distribution equipment, 998-22447106_GMA, 2022
- HSE, Keeping electrical switchgear safe, HSG230 2nd edition, 2015, paras 116–117
- Schneider Electric, Masterpact NT and NW Maintenance Guide, LVPED508016EN-02, 07/2013
- IFS damage database (Institut für Schadenverhütung und Schadenforschung der öffentlichen Versicherer), via Janitza, The Challenge of High Availability, 06/2020
- Power Quality and Load Research, Fortop Automation & Energy Control for Acteniq, anonymised, 12 December 2025 – 4 January 2026
- Acteniq site findings: UK food manufacturer onboarding review; UK university PD monitoring deployment